The 2026 Agent Workspace: Building a Resilient Call Center Analytics Dashboard

September 1, 2026
Every interaction a customer has with your contact center generates data. The problem isn’t collecting it — modern platforms do that automatically. The problem is whether anyone can see it clearly enough and fast enough to do something about it.
That starts with the agent workspace: the digital environment where agents access every tool, resource and piece of customer information they need to handle an interaction. It’s the operational center of gravity for your entire contact center, and in most organizations, it’s also where analytics either click into place or quietly fall apart.
What we talk about when we talk about data
Analytics can mean different things to different people. For a call center supervisor, it might mean a live queue view. For a VP of CX, it might mean monthly trend reports. For a frontline agents, it might mean… absolutely nothing visible to them at all. And that disconnect is exactly the problem.
A resilient call center analytics dashboard bridges all those layers. It doesn’t just collect data, it puts the right information in front of the right person at the right time, and in a format they can actually act on. In short, it makes information usable, not just available.
That means a supervisor can spot a spike in abandoned calls before it becomes a pattern. It means an agent who keeps hitting a wall on a specific issue gets the support they need before it becomes a bigger problem. And it means leadership isn’t waiting until the end of the month to find out something went sideways in week two.
The agent workspace is the starting point
Before we get into what your dashboard should measure, it’s worth naming something that often gets skipped: the agent workspace itself is an analytics surface.
Every interaction an agent handles generates data — handle time, wrap-up codes, customer sentiment, transfer rates, first-contact resolution. But if agents are toggling between five different windows, manually logging call notes, and fighting with a CRM that doesn’t talk to their dialer, that data is going to be messy, incomplete or just wrong.
The workspace an agent lives in every day should reduce friction, not create it. When agents work from a well-designed agent workspace, they spend less time navigating tools and systems and more time actually helping customers. And that shift shows up in the numbers: shorter handle times, better resolution rates, lower wrap-up time.
What a strong call center dashboard actually tracks
There’s no shortage of metrics a call center dashboard can display. The challenge is knowing which ones matter, and which ones are just noise dressed up in charts.
Metrics worth tracking in real time:
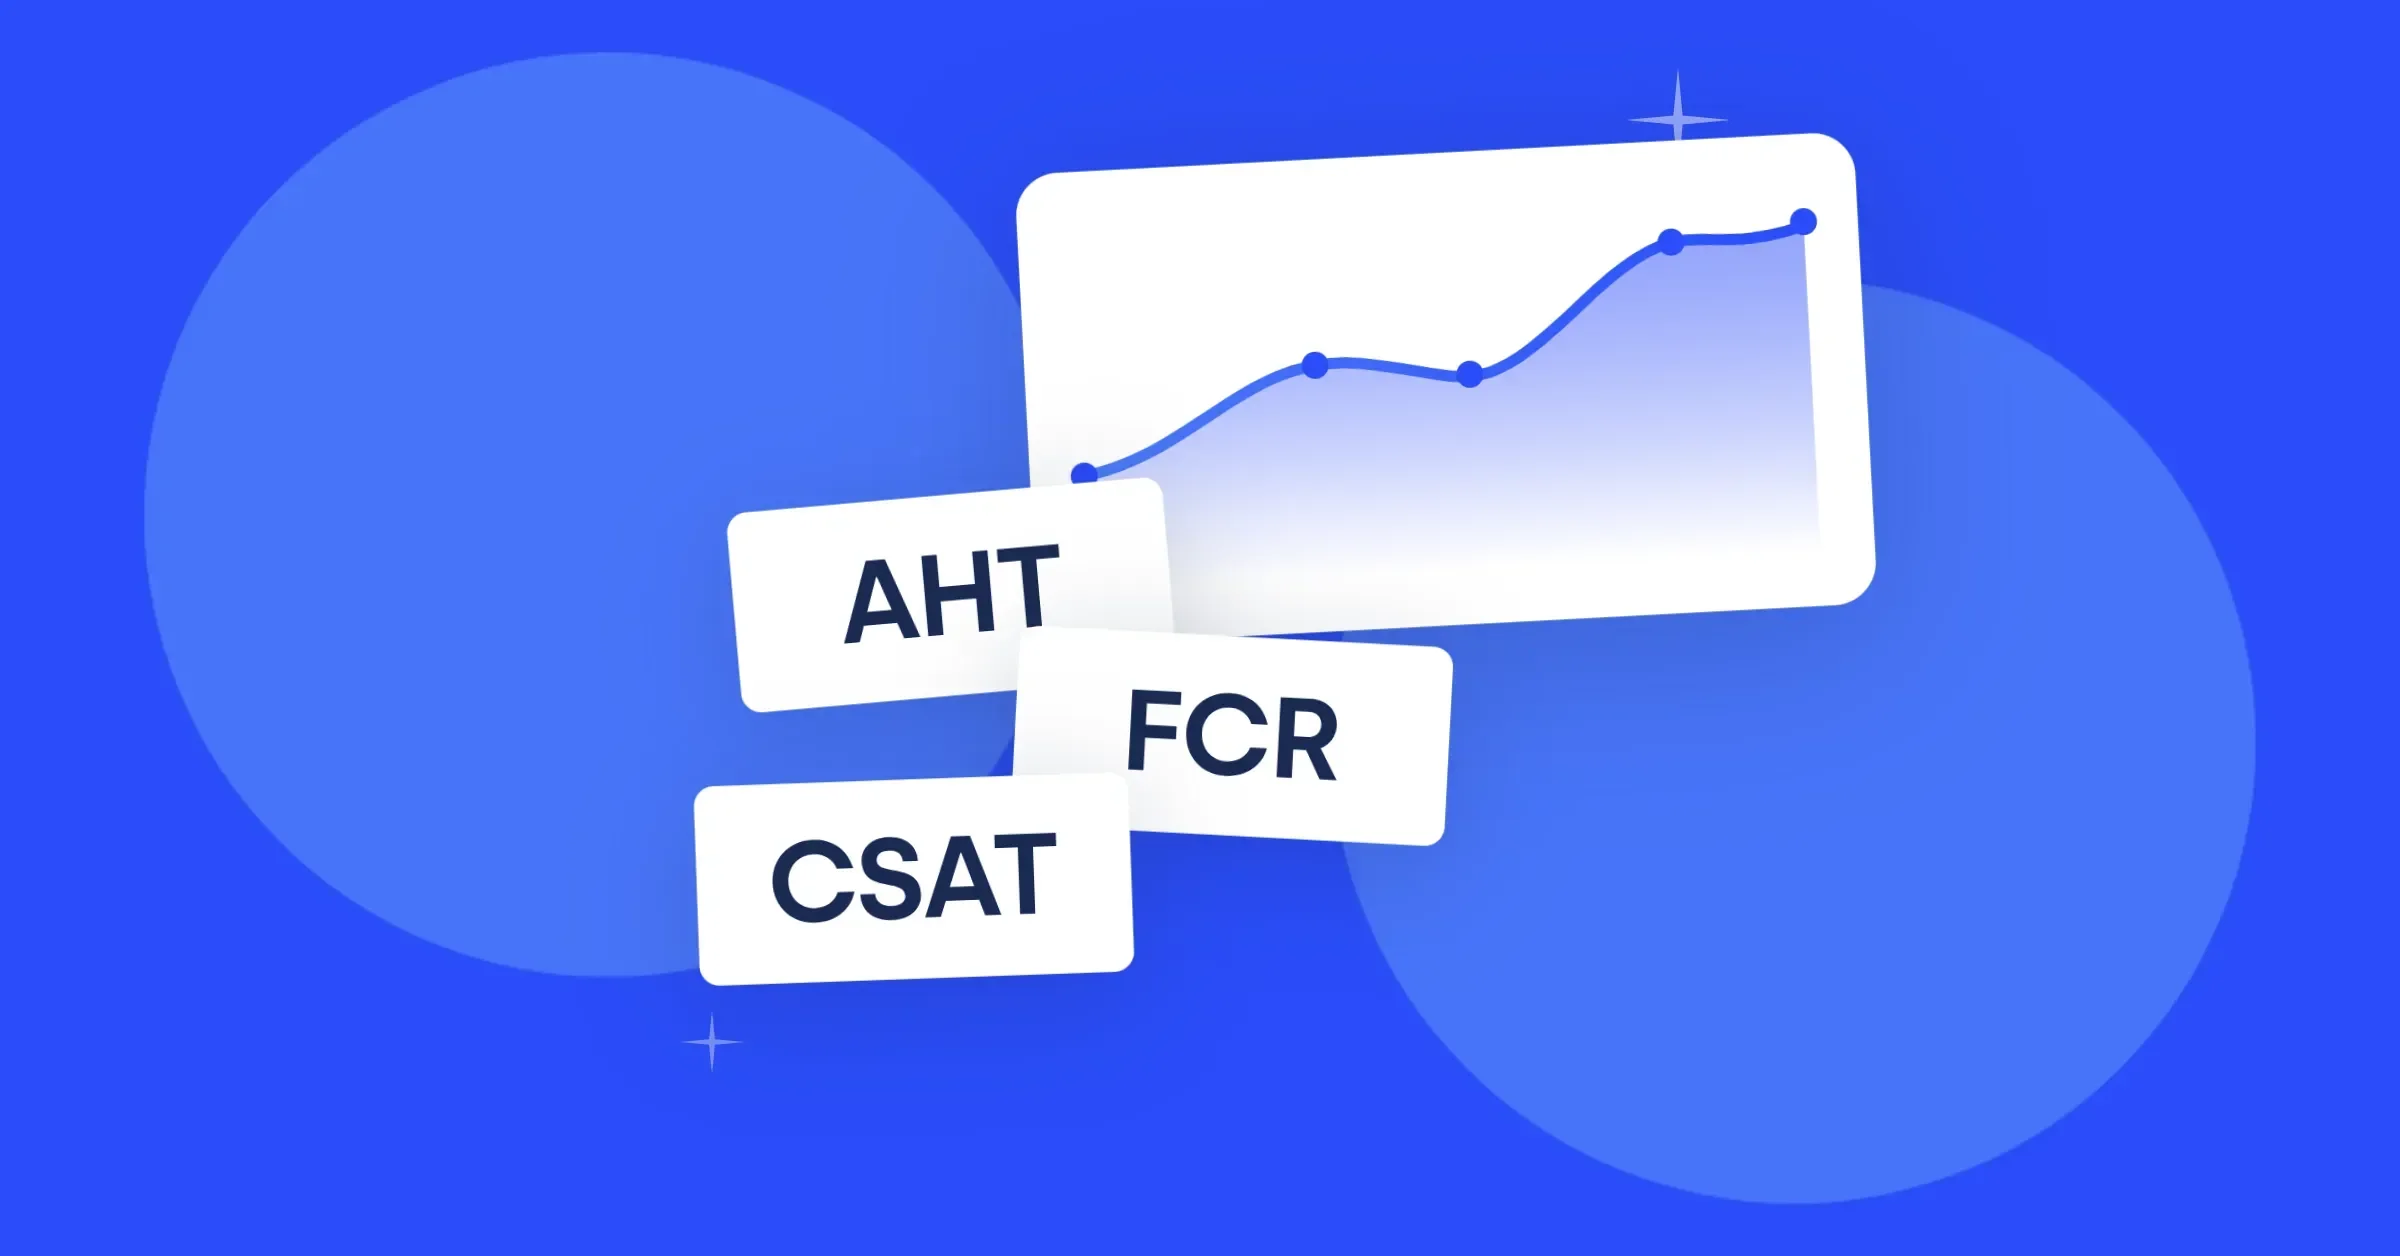
Average Handle Time (AHT) — How long agents spend on each interaction, including talk time and wrap-up. Useful for spotting outliers in both directions (too fast can mean quality issues; too slow can mean a training gap or a broken process).
First Call Resolution (FCR) — Whether a customer’s issue gets resolved without a callback or transfer. This is one of the clearest proxies for customer satisfaction, and it’s largely within the contact center’s control.
Abandonment Rate — Calls or chats dropped before reaching an agent. A sudden rise here often signals a staffing or routing problem.
Actual Waiting Time (AWT) — Self-explanatory, but critical. Customers who wait too long don’t wait; they leave.
Agent Utilization — How much of an agent’s available time is spent on active work vs. idle. High utilization isn’t always good if it leads to burnout; low utilization may mean overstaffing or scheduling mismatches.
Customer Satisfaction (CSAT) / Sentiment Scores — Post-interaction survey scores or AI-powered sentiment analysis from call recordings.
Metrics worth tracking over time:
FCR trends by team, channel and issue type
AHT variance by skill group
Transfer rates (sometimes a signal of misrouting or knowledge gaps)
Schedule adherence
Escalation frequency
The goal isn’t to track everything, but to track the right things in a way that makes patterns visible before they become problems.
AI is changing what the agent workspace can do
The most significant shift in contact center technology right now isn’t the dashboards themselves — it’s what’s powering them. AI-driven analytics can now surface patterns that would take human analyst hours to find, flagging things like a sudden increase in a specific wrap-up code or a cluster of customers calling about the same issue before it shows up in a formal report.
But AI’s impact on the agent workspace goes further than reporting. AI task automation handles the repetitive, post-call work that used to eat into agent time — automatic summaries, CRM updates, follow-up scheduling. That frees agents to focus on the actual conversation, which tends to produce better outcomes and better data.
Getting started
If you’re looking at your current setup and it feels more like a platform, the fix usually begins with the agent workspace. Clean up what agents see and how they log their work, and the analytics downstream get better almost automatically.
From there, define the ten to fifteen metrics that actually drive decisions in your operation — for example, the ones your supervisors check every morning. Build your call center dashboard around those. Make it visible, make it real-time where it matters, and make sure it’s accessible to the people who need to act on it.